Journal · Testing
HPLC purity: what 99% means, and what it leaves out
An HPLC purity of 99% means the main peak is 99% of all peak area the detector recorded: a ratio, not a weight.
Uses the lab reports of the 11 tested lots on this site
Key takeaways
- HPLC purity is the main peak's share of the total peak area the detector recorded.
- It is a ratio, not an amount: the milligrams in the vial are a separate measurement.
- Anything the detector does not record, or that leaves the column with the main peak, is not in the figure.
Purity is the number most people read first. It is a precise answer to a narrow question.
How HPLC separates a sample
Chromatography separates the components of a sample between two phases: one stays still, the other moves[1]. In high-performance liquid chromatography (HPLC), a dissolved sample is pumped through a packed column. Each component moves at its own speed and leaves the column at its own time. A detector at the end records a signal, and each component draws a peak.
From peaks to a percentage
The harmonised chromatography chapter of the European, US and Japanese pharmacopoeias describes the normalisation procedure. In it, a component's percentage is its peak area as a share of the total area of all the peaks. Peaks from solvents, reagents, the mobile phase or the sample matrix are left out, and so are peaks at or below the reporting threshold[1].
Purity (%) = main peak area ÷ total area of the counted peaks × 100
- A disturbance at the injection. Peaks from the solvent or the sample matrix are not counted.
- Small impurity peaks. Their areas count against purity.
- The main peak. Its share of the counted area is the purity figure.
- An impurity that leaves the column at the same time as the main peak hides inside it and is counted as main peak.
What the number leaves out
- What hides under the main peak. The pharmacopoeia defines a peak as the detector's response to one component, or to two or more components that were not separated[1]. An impurity that leaves the column with the main peak (4 in Figure 1) is counted as main peak.
- What falls below the threshold. Peaks at or below the reporting threshold are not counted[1].
- Counter-ions, salts and water. Synthetic peptides can carry counter-ions such as trifluoroacetate from their synthesis and purification[2]. These are not part of the peptide peak, which is one reason purity is not the same as content.
- Identity. Purity assumes the main peak is the right compound. Identity is tested with other methods, such as mass spectrometry[3]. The identity article explains how.
The impurities a synthetic peptide can carry
Most peptides are made by solid-phase peptide synthesis, which builds the chain one amino acid at a time. A review of peptide impurities sorts what can go wrong into two families[2].
- From synthesis: missing or extra amino acids (deletion and insertion sequences) and amino acids turned into their mirror image (racemization). Also leftover protecting groups, oxidation, and chains joined together (dimers).
- From degradation: chemical changes such as beta-elimination, diketopiperazine, pyroglutamate and succinimide formation.
Many of these molecules are close relatives of the peptide itself. Some, such as mirror-image forms, need specific methods to tell apart[4]. This is why a good purity figure comes from a method that separates them, and why it is read together with an identity test.
Purity on this site
9 of the 11 lots on this site have an HPLC purity figure. They run from 97.502% (3P1TH4L0N) to 99.903% (T1RZ3P4T1D3). The two blends (8PC Wolverine Stack, C1C-1295 + 1P4M0R3L1N) are reported as measured content for each peptide instead of one purity figure.
| Product | HPLC purity |
|---|---|
| T1RZ3P4T1D3Batch 2029/1 | 99.903% |
| S3L4NKLot SL-547 | 99.734% |
| 6HK-CULot GH-692 | 99.680% |
| S3M4XLot SM-381 | 99.662% |
| 8PC-157Lot BP-482 | 99.651% |
| T3S4M0R3L1NLot TE-156 | 99.639% |
| M0TS-CLot MC-823 | 99.393% |
| R3T4Batch 2029/1 | 99.234% |
| 3P1TH4L0NLot EP-470 | 97.502% |
97%98%99%100% |
How to read a purity figure
- Check that it is HPLC purity, for your lot, from an independent lab, with a report you can open at the lab.
- Read it with the identity result and the measured content: the three answer different questions.
- A purity number without a method, a lot or a report number is a claim, not a measurement.
Check it on real reports. The COA library has the full lab reports for 11 lots, with the original PDFs and links to the lab's own copies. Open the COA library
Sources
- Japanese Pharmacopoeia (PMDA). 2.00 Chromatography, harmonised with Ph. Eur. 2.2.46 and USP <621>. English text: introduction, definition of a peak, section 5.3 Normalisation procedure. pmda.go.jp (PDF)
- D'Hondt M, Bracke N, Taevernier L, Gevaert B, Verbeke F, Wynendaele E, De Spiegeleer B. Related impurities in peptide medicines. Journal of Pharmaceutical and Biomedical Analysis 2014;101:2-30. doi.org/10.1016/j.jpba.2014.06.012
- McCarthy D, Han Y, Carrick K, Schmidt D, Workman W, Matejtschuk P, Duru C, Atouf F. Reference standards to support quality of synthetic peptide therapeutics. Pharmaceutical Research 2023;40(6):1317-1328. Open access. doi.org/10.1007/s11095-023-03493-1
- Lian Z, Wang N, Tian Y, Huang L. Characterization of synthetic peptide therapeutics using liquid chromatography-mass spectrometry: challenges, solutions, pitfalls, and future perspectives. Journal of the American Society for Mass Spectrometry 2021;32(8):1852-1860. doi.org/10.1021/jasms.0c00479
Each source was read in its own document on 16 Oct 2026. Numbers about BP's lots come from the reports in the COA library.
How this article was made
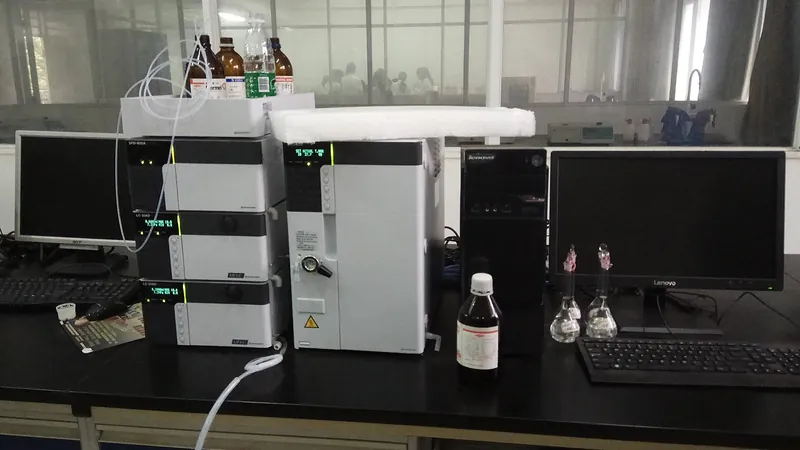
Written by Bali Peptide Supply from the sources listed above, each read in its own document on 16 Oct 2026. Every number about our lots comes from the Janoshik Analytical reports in the COA library, read by the site build, not typed by hand. The lead photo is from Wikimedia Commons under a free licence.
BP sells research materials for laboratory use only. This article explains laboratory testing and lab reports. It is not medical advice and not instructions for use.
Keep reading
 Testing
Identity first: how LC-MS shows what is in the vial
A very pure sample of the wrong compound is still the wrong compound. Identity is the first question a report should answer.
3 min read · 5 sources Reading reports
Measured content versus the label: why the numbers differ
The label is the amount the vial is meant to hold. The report is the amount the lab found. They are rarely identical.
2 min read · 4 sources Reading reports
How to read a Janoshik test report, field by field
A lab report answers a few precise questions. This guide takes one real report from our COA library and reads it one field at a time.
4 min read · 3 sources